
What can you do with it?

Real time insight
into your results

Direct actions for
the highest priorities

Compare segments
An impression from the dashboard
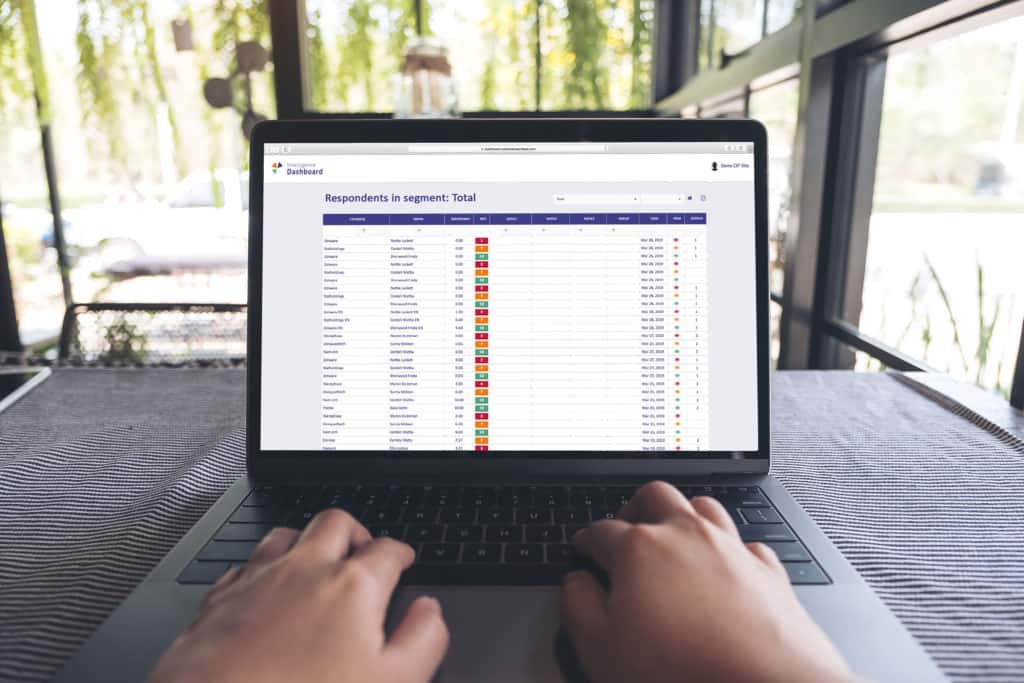

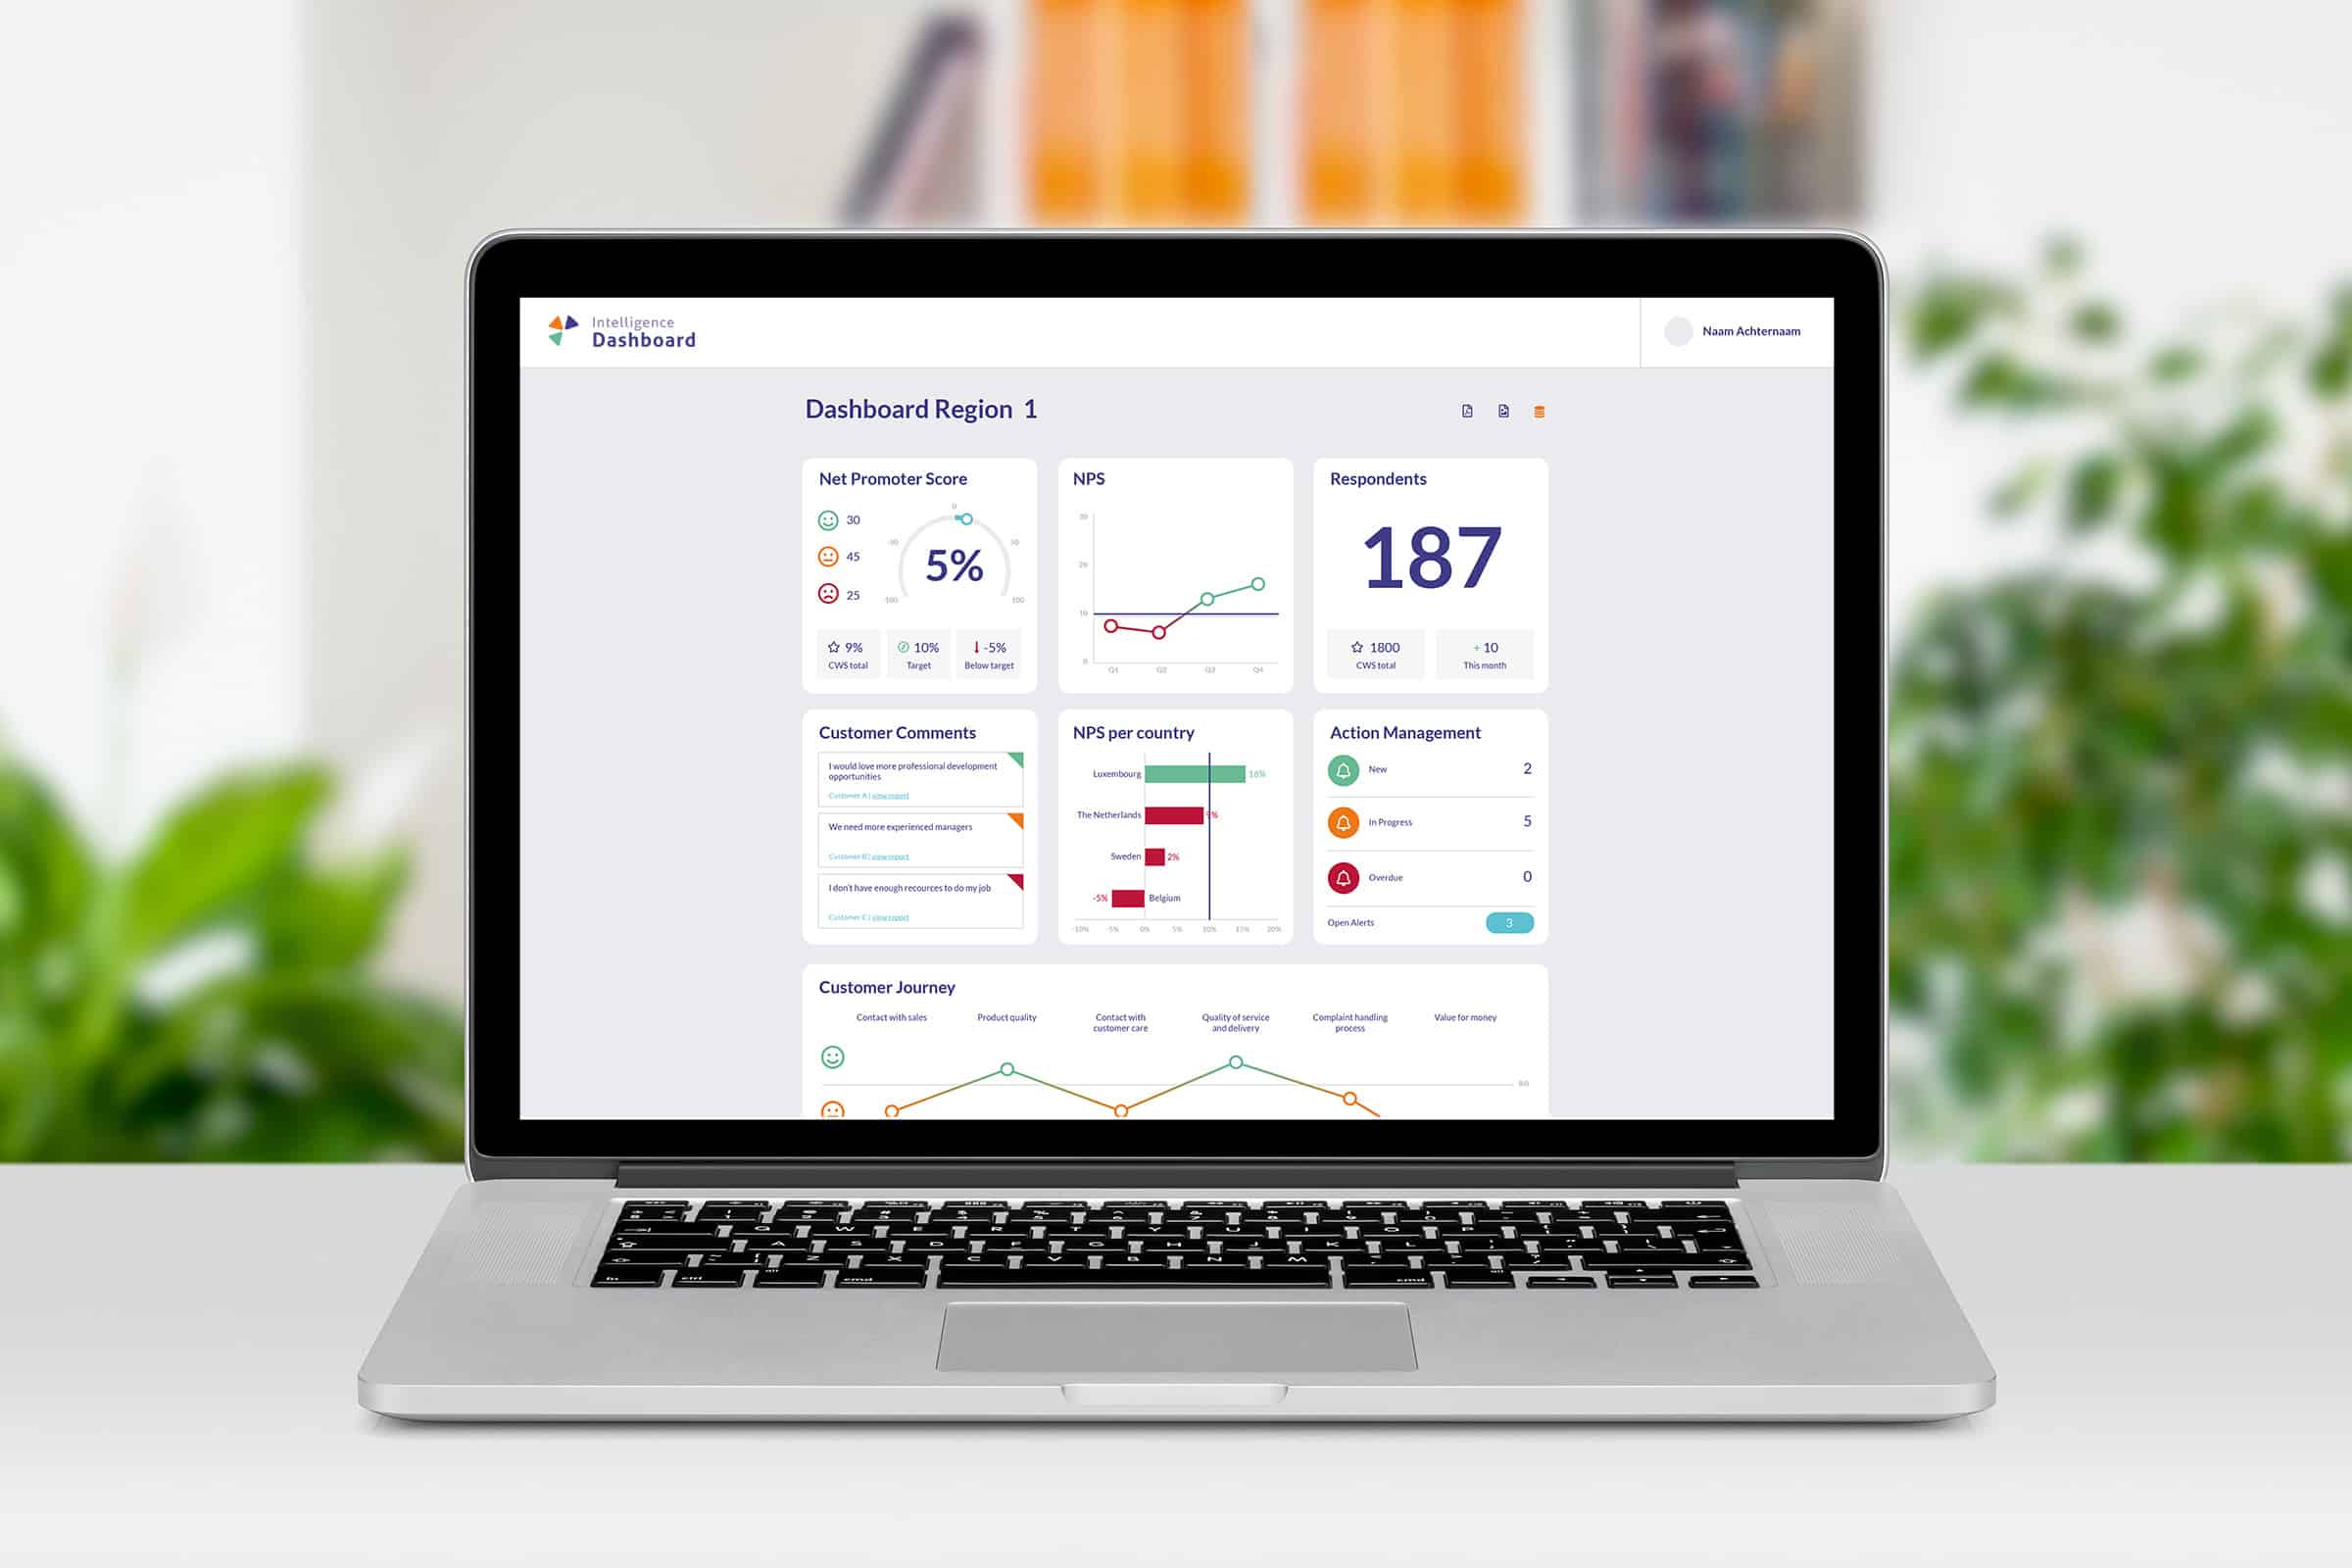
Real-time insight with our Business Intelligence Dashboard
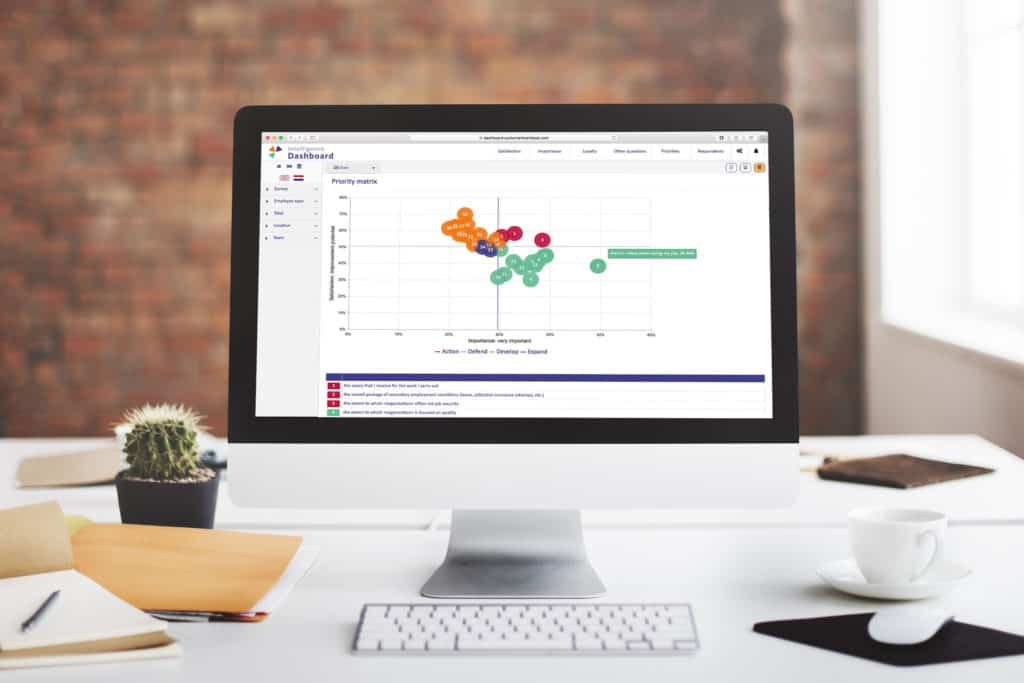
Extensive analyses are made with the business intelligence dashboard. Depending on the scope of the research, segments, blood groups and differences over time can be compared and exported. In addition, the dashboard provides insight into which aspects have the greatest potential for improvement through a priority matrix and a ‘top 10’ of improvement points. The satisfaction and the importance of each aspect according to the respondent are examined.


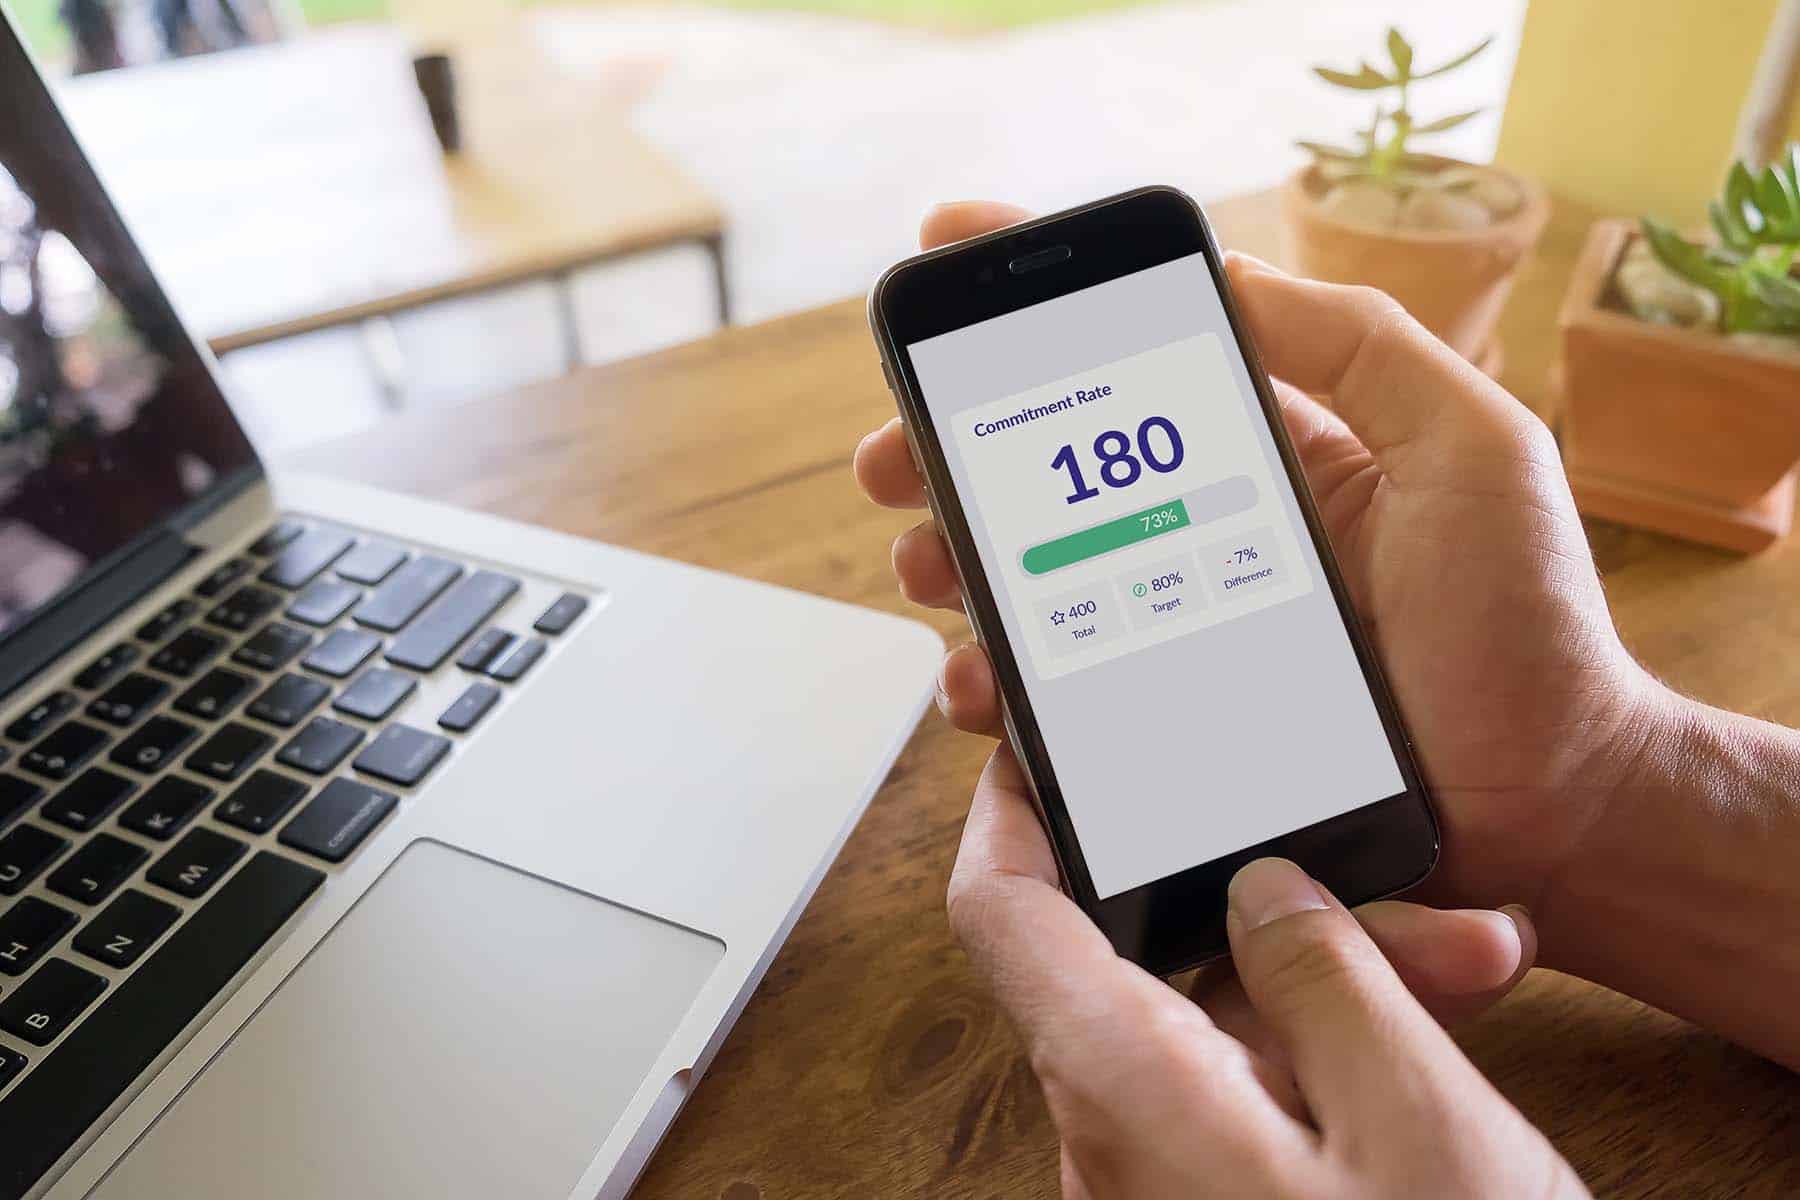
User dashboard
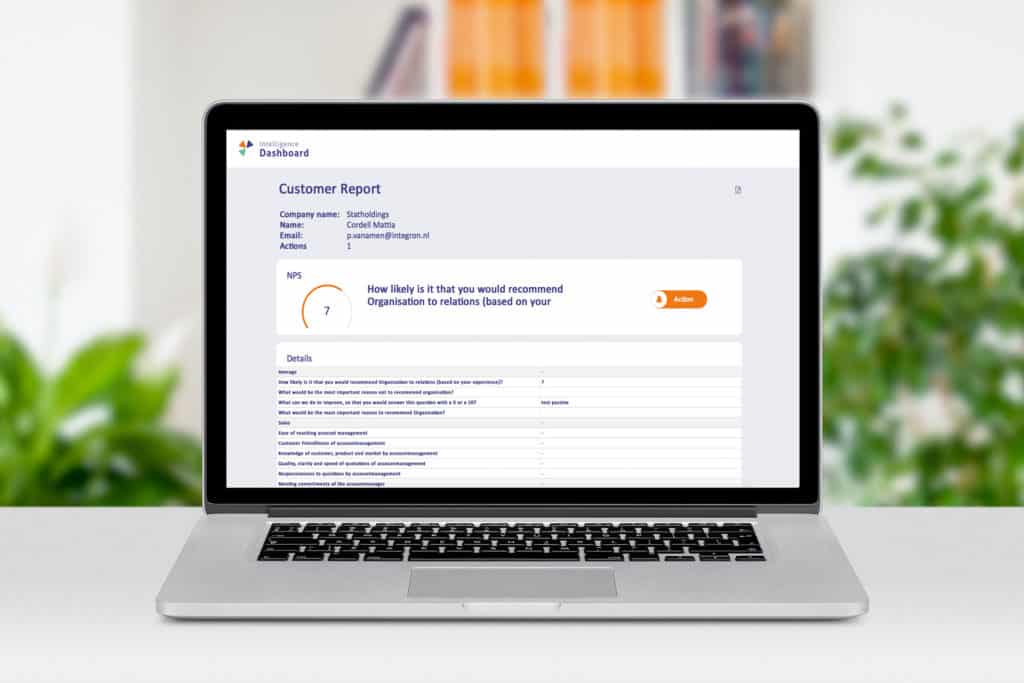
The tile dashboard provides shielded information for specific function groups such as management, HR, marketing and sales managers. This dashboard can be customised for each function group. In this way, insights that really matter are visualized visually by function group. Examples include (but not limited to) the customer or employee journey, the priority matrix, the set of actions and qualitative answers to of NPS and eNPS surveys.
Alerts en activation management
For some research trajectories, alerts can be set based on positive, neutral or negative feedback. For example, if an account manager gets a positive or negative NPS from a customer, they receive a notification and can take immediate action.. With activation management, managers can set out actions to those involved in your organization and the progress of these actions can be kept in a clear overview.

Do you want to experience the possibilities of our dashboard?
Contact us and we are happy to give you a tour.